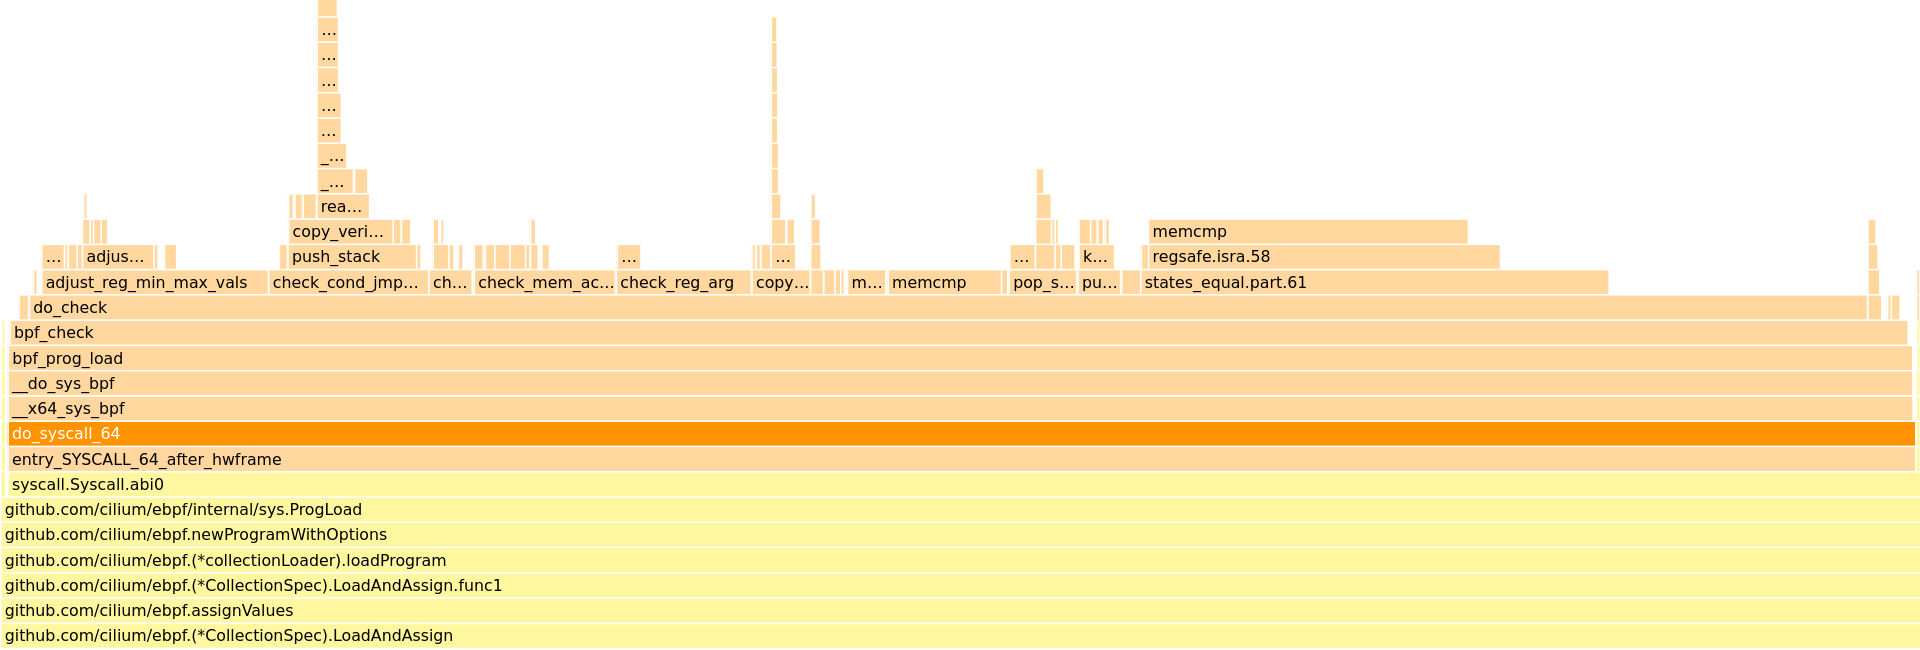
Earlier this week I was made aware of what appeared to be an infinite loop in the in-kernel BPF verifier. Golang stacks were pulled, flamegraphs were captured (shoutout to profiler.firefox.com), and by all appearances it seemed like there was indeed an infinite loop.
I spent some time studying the verifier source and nothing really stood out to me as infinite loopable. Plus, the flamegraph showed a rather equal distribution of callees so the verifier being stuck in a single place seemed unlikely.
By some random chance I thought it would be useful to see how often the verifier was being called. I answered that question by running the following bpftrace script for a few seconds:
$ sudo ./bpftrace -e 't:syscalls:sys_enter_bpf { @ = count(); }'
Attaching 1 probe...
^C

@: 932
So clearly this was not an infinite loop but rather
bpf(BPF_PROG_LOAD, ...) being called in a tight loop. That
by itself seemed rather odd so I took to the cilium/ebpf
source. A quick dig turned up:
// BPF wraps SYS_BPF.
//
// Any pointers contained in attr must use the Pointer type from this package.
func BPF(cmd Cmd, attr unsafe.Pointer, size uintptr) (uintptr, error) {
    for {
        r1, _, errNo := unix.Syscall(unix.SYS_BPF, uintptr(cmd), uintptr(attr), size)
        runtime.KeepAlive(attr)

        // As of ~4.20 the verifier can be interrupted by a signal,
        // and returns EAGAIN in that case.
        if errNo == unix.EAGAIN && cmd == BPF_PROG_LOAD {
            continue
        }

        var err error
        if errNo != 0 {
            err = wrappedErrno{errNo}
        }

        return r1, err
    }
}
Ah ha, so the looping condition is -EAGAIN. I quickly
verified that by running:
$ sudo ./bpftrace -e 't:syscalls:sys_exit_bpf { @[args->ret] = count(); }'
Attaching 1 probe...
^C

@[-11]: 543
-EAGAIN is -11, so great. That’s
confirmation.
To answer why the verifier would ever return -EAGAIN, I
grepped through kernel/bpf/verifier.c. It turns out there’s
precisely one occurence of -EAGAIN in the file (which
contains all verifier logic):
static int do_check(struct bpf_verifier_env *env)
{
        /* [...] */
        for (;;) {
                struct bpf_insn *insn;

                /* [...] */
                insn = &insns[env->insn_idx];
                class = BPF_CLASS(insn->code);

                /* [...] */
                if (signal_pending(current))
                        return -EAGAIN;

                /* Main logic follows */
So the only reason the verifier would return -EAGAIN is
if there is a pending signal waiting for the caller.
In general this would be pretty difficult to debug b/c any code modification could potentially disturb the bad state. Fortunately, we can turn to bpftrace:
$ sudo ./bpftrace -e 't:syscalls:sys_exit_bpf { @[args->ret] = count(); } t:signal:signal_deliver / pid == $1 / { @sigs[args->sig] = count() }' $(pidof binary-under-investigation)
Attaching 2 probes...
^C

@[-11]: 876
@sigs[27]: 1136
Here lies the smoking gun: signal 27 is SIGPROF. From
here, two things were realized:
SIGPROF to samplepprof based
profilingIn other words, what was happening was:
pprof was sending
SIGPROF at high enough frequency to prevent verifier from
completing its workcilium/ebpf kept retrying
bpf(BPF_PROG_LOAD, ..) because it received
-EAGAINsThis was a really nice bug b/c it’s simple to grok and totally non-obvious.
My only takeaway is that I’m not sure I like go’s signal based
profiling mechanism. It intereres quite heavily with long-running
syscalls like bpf(BPF_PROG_LOAD, ...). I would much rather
prefer using PMU-based
profilers like perf.